|
D4 The Hardy–Weinberg principle (HL only)
|
p + q = 1
(p + q)2 = 1
(p + q)(p + q) = 1
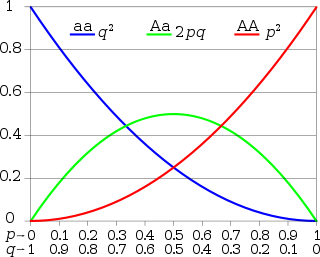
p2 + 2pq + q2 = 1
|
|
D.4.1
Explain how the Hardy–Weinberg equation is derived.
|
The Hardy-Weinberg equation (p2 + 2pq + q2 = 1) is used to determine allele frequencies and genotype frequencies for a population.
It is used for traits that show Mendelian inheritance:
- only two alleles for a gene
- one dominant and one recessive allele
- autosomal, not sex-linked traits
p = the frequency of the dominant allele
q = the frequency of the recessive allele
- frequencies are written as decimal numbers, not as percentages
- for example, p = 0.90 and q = 0.10, not 90% and 10%
Because the traits only have two alleles: p + q = 1
Genotype frequencies consist of two alleles, so the equation is squared: (p + q)2 = 1
This is expanded to: p2 + 2pq + q2 = 1
p2 = the frequency of the homozygous dominant genotype
2pq = the frequency of the heterozygous genotype
q2 = the frequency of the homozygous recessive genotype
For IB,
- define each variable
- explain how to derive the first equation
- explain how to derive the second equation
|
|
D.4.2
Calculate allele, genotype and phenotype frequencies for two alleles of a gene, using the Hardy–Weinberg equation.
|
How to use the Hardy-Weinberg equation

http://www.phschool.com/science/biology_place/labbench/lab8/intro.html
The allele for pink color is dominant, and the allele for black color is recessive.
A = pink color allele
a = black color allele
Can you calculate the allele frequency of the black color allele?
There are four black pigs, but the pink pigs could be homozygous (AA) or heterozygous (Aa)
So you can't determine the allele frequency...
...unless you use the Hardy-Weinberg equation.
Calculate q2 the frequency of homozygous recessive genotypes (black pigs).
- q2 = (4 black pigs / 16 total pigs) = 0.25
- Or 25% of the population have black color
Calculate q the frequency of the 'a' allele.
- q = [square root of q2] = [square root of 0.25] = 0.5
- Or 50% of the alleles in the gene pool are 'a'
Calculate p the frequency of the 'A' allele.
Remember p + q = 1
- so p = 1 - q
- p = 1 - 0.5 = 0.5
Calculate the genotype frequencies using p2 + 2pq + q2 = 1
p2 = 0.52 = 0.25
2pq = 2 x 0.5 x 0.5 = 0.5
q2 = 0.52 = 0.25
- Check to be sure it adds up to 1.
Describe the phenotypes.
p2 and 2pq have pink color, so the frequency of pink color is 0.25 + 0.5 = 0.75
q2 have black color, so the frequency of black color is 0.25
Hurray for Hardy! Wee for Weinberg!
Practice:
In a population of 278 mice, 250 are black and 28 are brown. The alleles are B = black and b = brown. Calculate the frequencies.
- frequency of the recessive allele
- frequency of the dominant allele
- frequency of the homozygous dominant genotype
- frequency of the heterozygous genotype
- frequency of the homozygous recessive genotype
|
|
D.4.3
State the assumptions made when the Hardy–Weinberg equation is used.
|
The Hardy-Weinberg principle predicts frequencies for populations that are not evolving.
- This state is called Hardy-Weinberg equilibrium.
- The allele frequencies remain constant over generations
It is a hypothetical state (not real) used to show what is necessary for evolution.
Five assumptions are necessary for Hardy-Weinberg equilibrium to exist:
- Large population (no genetic drift)
- Random mating (no sexual selection, no sex-linked traits)
- No mutation (no new alleles or multiple alleles)
- No migration (no gene flow - emigration or immigration)
- No natural selection (no differential survival based on inherited traits)
....then allele frequencies will remain constant.
The Hardy-Weinberg principle helps to demonstrate that the opposites of the assumptions listed above do cause evolution.
- If allele frequencies change, then one or more of the five assumptions does not exist and is causing evolution.
|
|
|
- As a group, review the quizzes and teach each other how to solve the problems.
|
| |
|
|
D5 Phylogeny and systematics (HL only)
Review Questions
|
"There is a grandeur in this view of life....that whilst this planet has gone cycling on according to the fixed law of gravity, from so simple a beginning endless forms most beautiful and most wonderful have been, and are being created."
Darwin, 1859
|
|
D.5.1
Outline the value of classifying organisms.
This refers to natural classification. Include how the organization of data assists in identifying organisms, suggests evolutionary links, and allows prediction of characteristics shared by members of a group.
|
Taxonomy: the science of classification of organisms into groups.
Why do we do this?
- Establishing groups helps to classify unknown organisms.
- Classification shows evolutionary relationships.
- Classification predicts similar characteristics among closely related species.
|
|
D.5.5
Define clade and cladistics.
|
Vocabulary
Phylogeny: the evolutionary history of a species or higher group of organisms.
Systematics: the study of the evolutionary relationships among species and higher groups living and extinct.
Cladistics: method of classifying species based on their shared inherited characteristics.
Clade: a group consisting of an ancestor and all of its descendants.
Cladogram: an "evolutionary tree" diagram that illustrates evolutionary relationships among species.
A cladogram with different clades outlined: (in French)
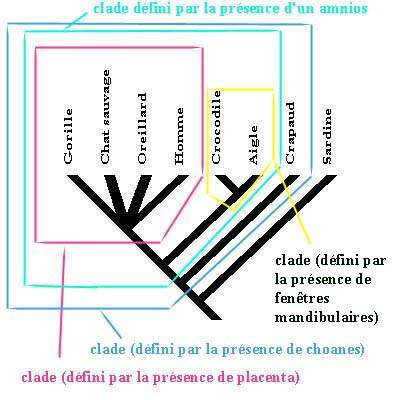
http://www.inrp.fr/Acces/biotic/evolut/phylogene/documentation/html/clade.htm
|
|
D.5.2
Explain the biochemical evidence provided by the universality of DNA and protein structures for the common ancestry of living organisms.
TOK: The universality of DNA and the genetic code had a profound effect on Marshall Nirenberg and other pioneering biochemists, as it showed that humans were part of the overall tree of life and were not set apart genetically. This must affect the way in which we view ourselves and the rest of the living world.
|
In the 1800s, Darwin and Mendel had no idea about DNA's role in evolution.
In the 1900s, the identification of DNA as the genetic material and its mechanisms of inheritance and protein synthesis validated Darwin's and Mendel's research.
DNA research also confirmed the idea that all living things on Earth evolved from a common ancestor.
Evidence:
- all living things use DNA as their genetic material
- all living things can express genes from other species - as is done in genetic engineering
- all living things use the same 20 amino acids to build proteins
- (amino acids can exist as stereoisomers (two mirror images/like your left and right hands) but all living things only use "left-handed" amino acids)
This evidence supports the idea that all living things on Earth evolved from a common ancestor.
|
|
D.5.3
Explain how variations in specific molecules can indicate phylogeny.
TOK: Variations are partly due to mutations, which are unpredictable and chance events, so there must be caution in interpreting them.
|
Molecular Variations indicate Phylogeny
Protein and DNA sequences from two species can be compared for simlarities and differences.
The amount of variation can indicate the relationship between two species:
- Low variation = close evolutionary relationship
- High variation = distant evolutionary relationship
Consider the DNA sequences from four species:
- AAAATTTTCCCCGGGG
- AAAATTTACCCCGGGG
- AAAATTTACCCGCGGG
- AACATCTTCCACGCTG
Species 1 has the most similarity with Species 2 and less with Species 3 and the least with Species 4.
So, Species 1 and 2 are the most closely related, and Species 3 and 4 are more distantly related.
|
|
D.5.4
Discuss how biochemical variations can be used as an evolutionary clock.
TOK: We must be careful not to suggest that this clock moves on at a constant and invariable rate, so interpretation of data here must be very carefully done, with the uncertainties made clear.
|
The Evolutionary Clock
Mutation occurs at a variable rate, but it does make measurable differences in DNA.
Measuring differences in DNA and proteins caused by mutations can indicate the amount of time since the speciation of two groups.
The DNA sequences between Species A and B are compared, and they show 26 differences.
The DNA sequences between Species A and C are compared, and they show 83 differences.
Since Species A nd B have less differences, their speciation was more recent.
And Species A and C have more differences, their speciation was more distant.
- More time has passed since A and C split, so there was more time for more mutations to happen.
- Species A and B split more recently, so there was less time for mutations to occur.
But because mutation rates can vary over time, the evolutionary clock is not an exact measurement of time.
The word "Clock" may not be the best metaphor.
It is only a relative measurement of evolutionary distance between species.
Evolutionary clock data is often combined with radiometric dating and morphological fossil evidence to establish a better relationship with real time and other species.
|
|
D.5.6
Distinguish, with examples, between analogous and homologous characteristics.
|
Homologous characteristics are structures among species that are derived from a common ancestor.
- All the descendants have similar structures, though they may have different functions.
- Examples: forelimbs in mammals - whales, humans, cats, bats.
Analogous characteristics are similar among species but are not derived from a common ancestor.
- They may have similar functions, but their structures are different.
- Examples: wings in birds, insects, bats, pterosaurs.
|
|
D.5.7
Outline the methods used to construct cladograms and the conclusions that can be drawn from them.
D.5.8
Construct a simple cladogram.
|
Constructing a Cladogram
- Make a table listing the organisms and derived traits.
- List the organisms in the first column and the traits in the first row.
- Write "Total" for the heading for the last column.
- Check the boxes if the organism has the trait.
- Write the total number of traits checked in the last column.
- Draw the first branch of the cladogram for the organism withe the fewest derived traits.
- Draw the branches for the other organisms based on the number of derived traits, with the organism with the most traits as the last branch.
- optional: write the traits between the nodes.
Example table:

Example cladogram:

Conclusions
The clagogram shows the evolutionary relationships among the species.
- Species that branch off near the bottom evolved the earliest.
- Species that branch off near the top evolved more recently.
- Each split in the cladogram (called a node) shows a speciation event.
Cladistics uses the idea of parsimony to create cladograms - the most simple explanation is most likely correct.
- If a trait evolved more than one time, then the cladogram would look different.
- But parsimony maintains that each trait evolved only one time.
Assignment: Construct a cladogram
- Organisms: Paramecium (unicellular eukaryote), flatworm, shark, hawk, koala, camel, human.
- Traits: eukaryotic, multicellular, vertebrate, amniotic egg, hair, placenta, opposable thumb.
|
|
D.5.9
Analyse cladograms in terms of phylogenetic relationships.
|
Analyzing a cladogram
What trait do all the organsims share?
- This tells us a trait of the common ancestor of all the organisms in the cladogram.
What does the position of an organism show?
- The lower an organism branched, the earlier it evolved.
What else does the order of the branching show?
- Two organisms on successive branches are more closely related than organisms separated by one or more branches (or nodes).
What are the clades?
- The traits used to define the branches indicate a common characteristic of the clade above the branch that doesn't have the trait.
|
|
D.5.10
Discuss the relationship between cladograms and the classification of living organisms.
|
Cladistics
Cladistics attempts to define the most logical and natural relationships among organisms.
- This is done by using morphological data and biochemical data.
- The use of molecular data has changed the classification of many species compared with older systems that were solely based on morphology.
Each cladogram is a hypothesis.
- It needs to be tested repeatedly which allows for some skepticism as new data would change the cladogram.
The selection of derived traits used to define clades can cause controversy.
- In the old Linnaean classification system - grouping organisms based on morphological data into kingdom, phylum, class, order, family, genus, species - birds were a distinct class from reptiles because of their feathers.
- But new data - fused clavicle, hollow bones, egg shells, backward knees - and the idea of parsimony places birds in a clade derived from dinosaurs, not in a distinct class.
Cladistics changed the focus of classification from finding ancestors to analyzing shared derived characteristics among extant species.
|

Comments (0)
You don't have permission to comment on this page.